
Your Personal Market Time Machine
Visualize financial history with our timeline of key market data and events since 1935

Endorsed by Industry Experts


The Perfect Conversation Starter
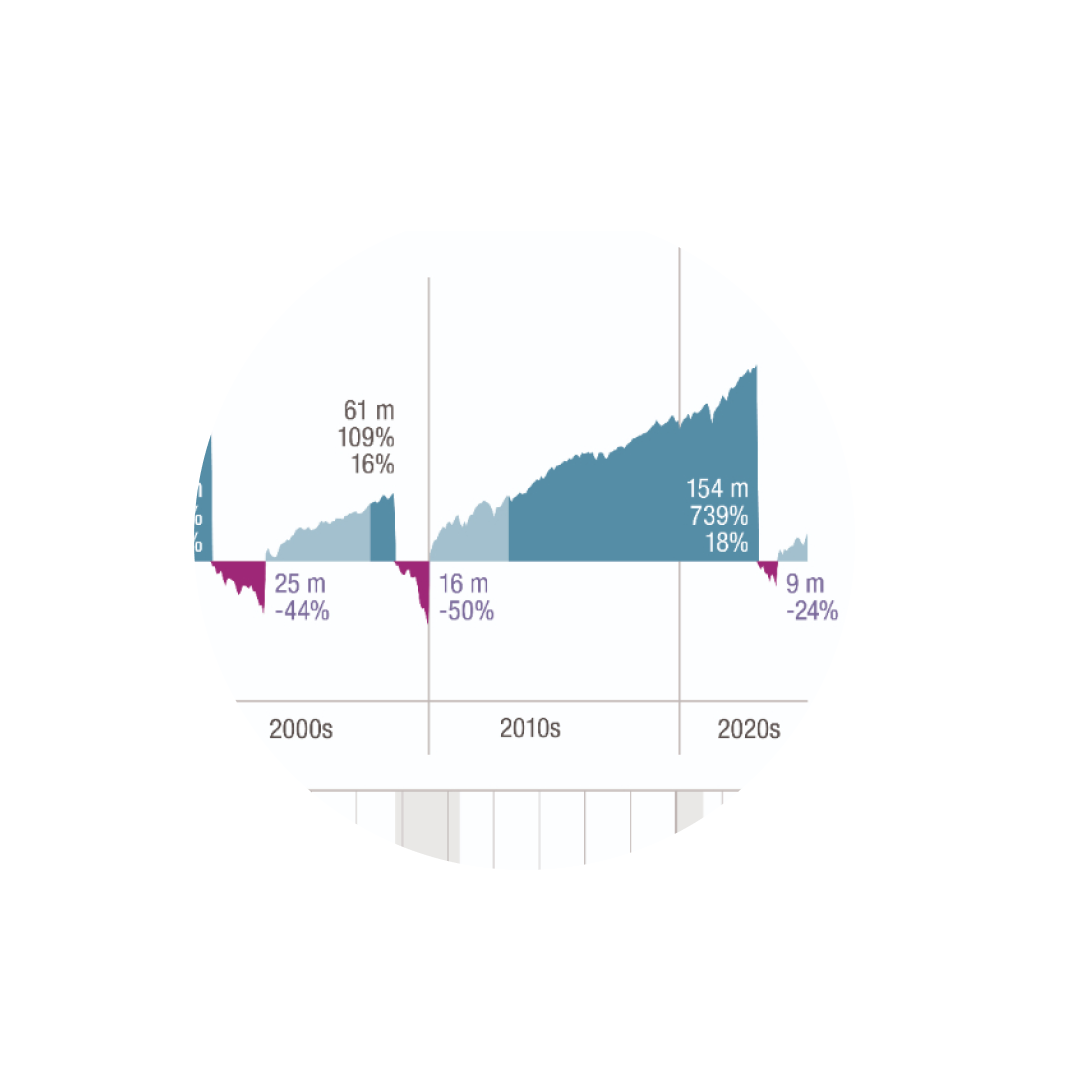
Downturns & Recoveries
Since 1926, stocks have fallen by over 20 percent on eight occasions, but following each downturn, they have recovered and gone on to reach new highs
Diversification
Compare how different investment mixes have balanced returns and stability over time
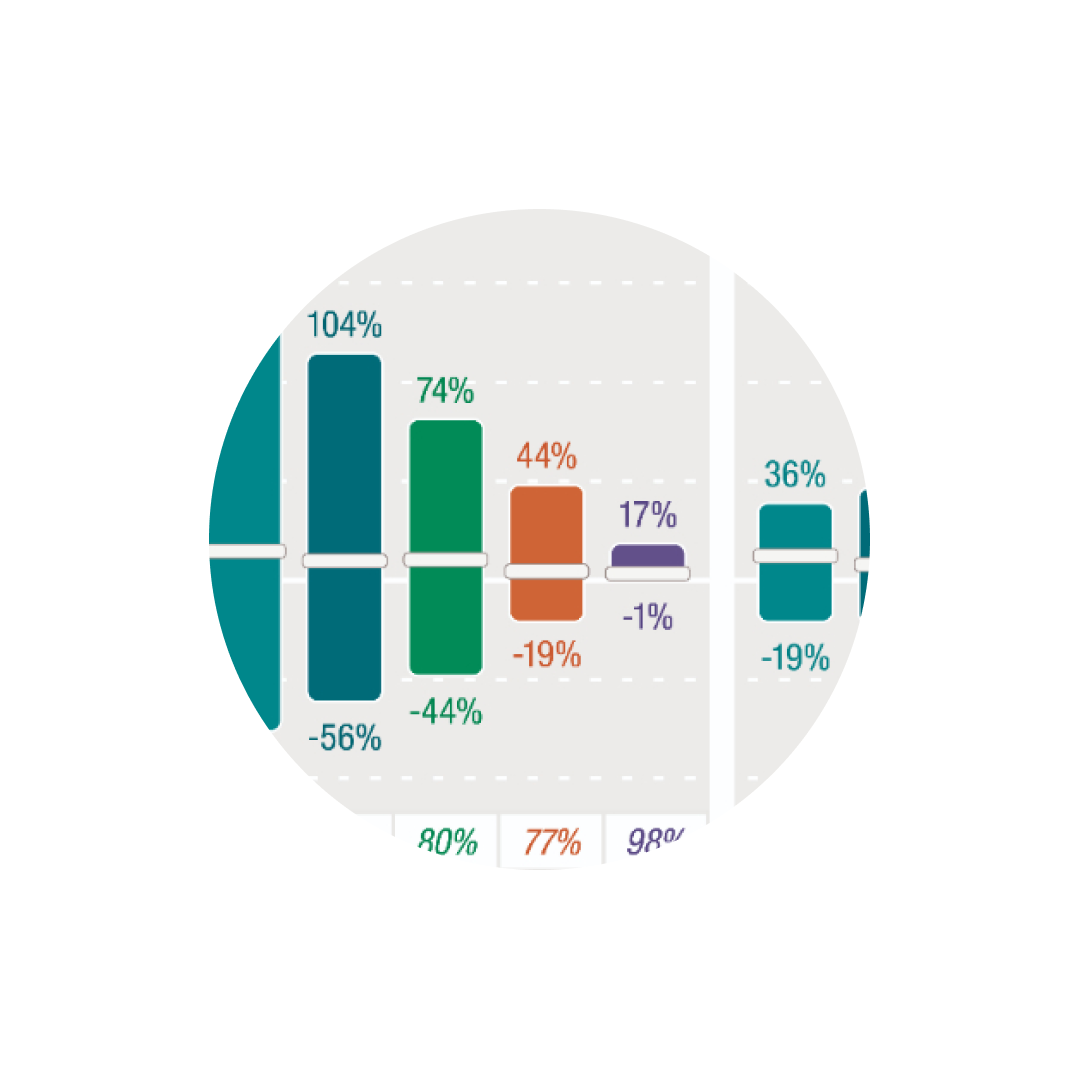
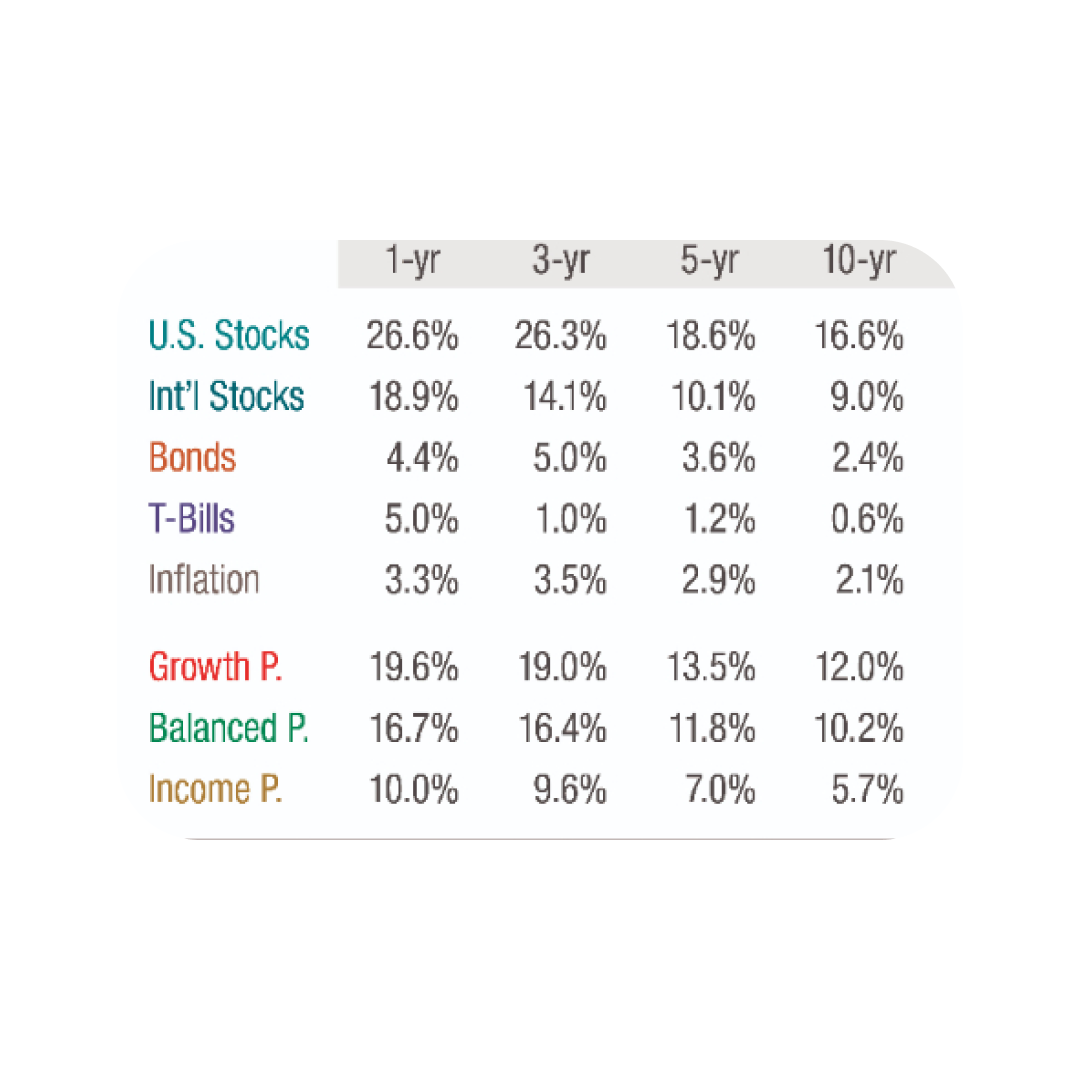
Risk & Return
Stocks have historically outperformed, but with higher volatility. Balanced portfolios offer a smoother ride during downturns
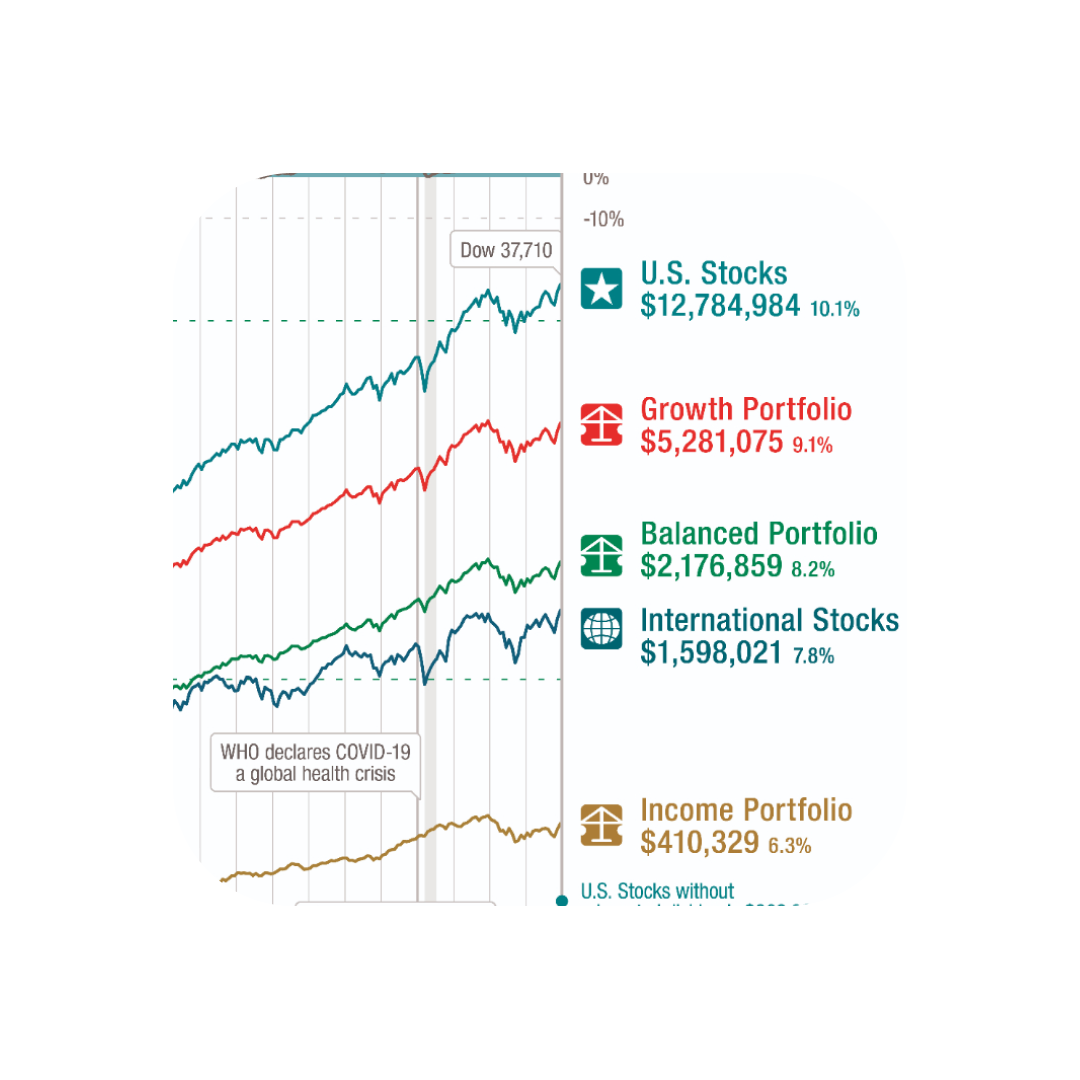
Staying Invested
Despite 16 recessions and numerous crises, U.S stocks have turned $1 into $12,000 over the past century
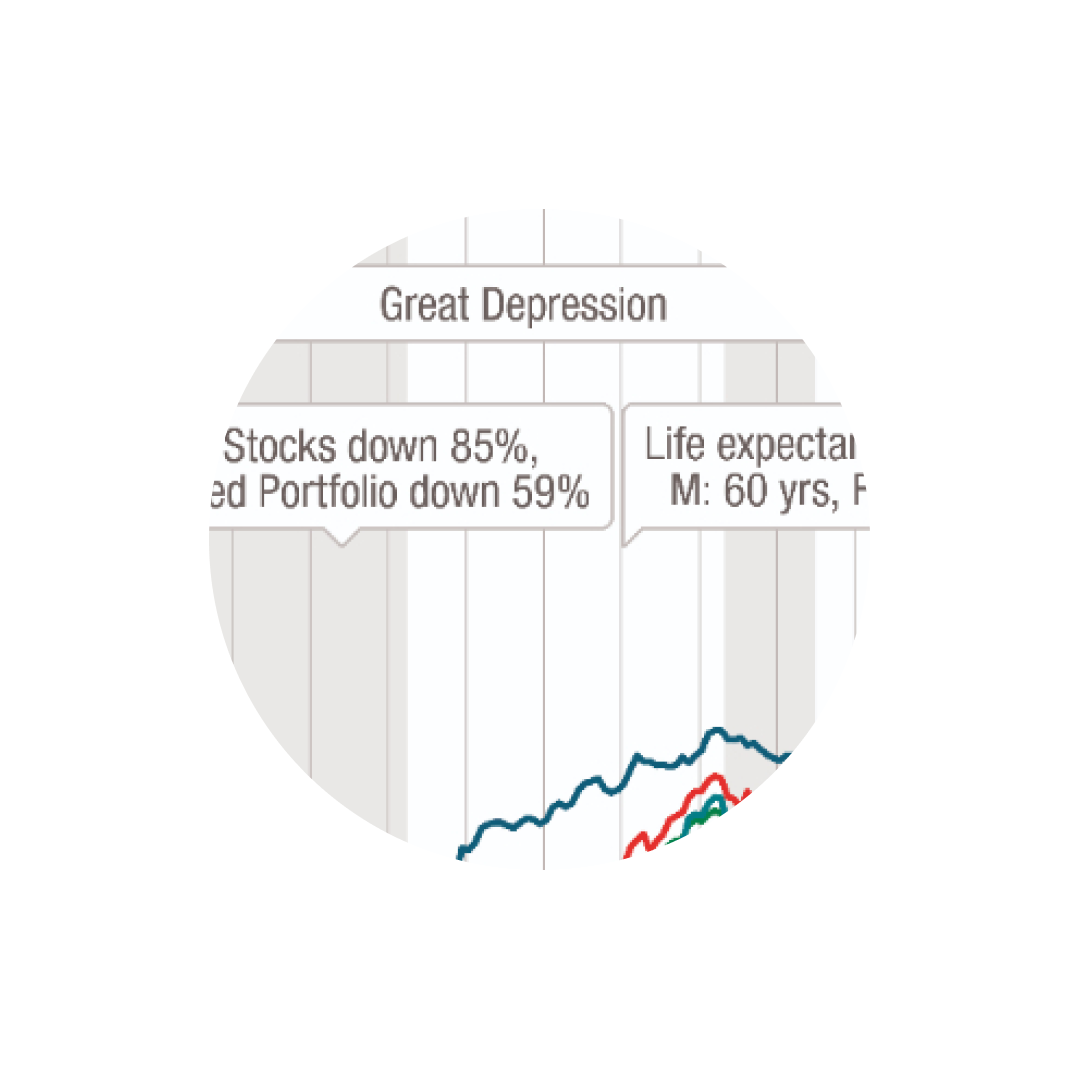
Historical Context
From recessions to oil prices, global events shape market performance across all asset classes