
Investments Illustrated
2025 Big Picture Wall Chart - U.S. Edition
For a single unit, discounts apply when you buy 2 or more
Dimensions: 37.75" × 25.25"
View full details
Order the Handout Version

Investments Illustrated
2025 Big Picture Handout - U.S Edition
For a single unit, discounts apply when you buy 2 or more
Dimensions: 8.5" x 11", opens to 11" x 17"
View full details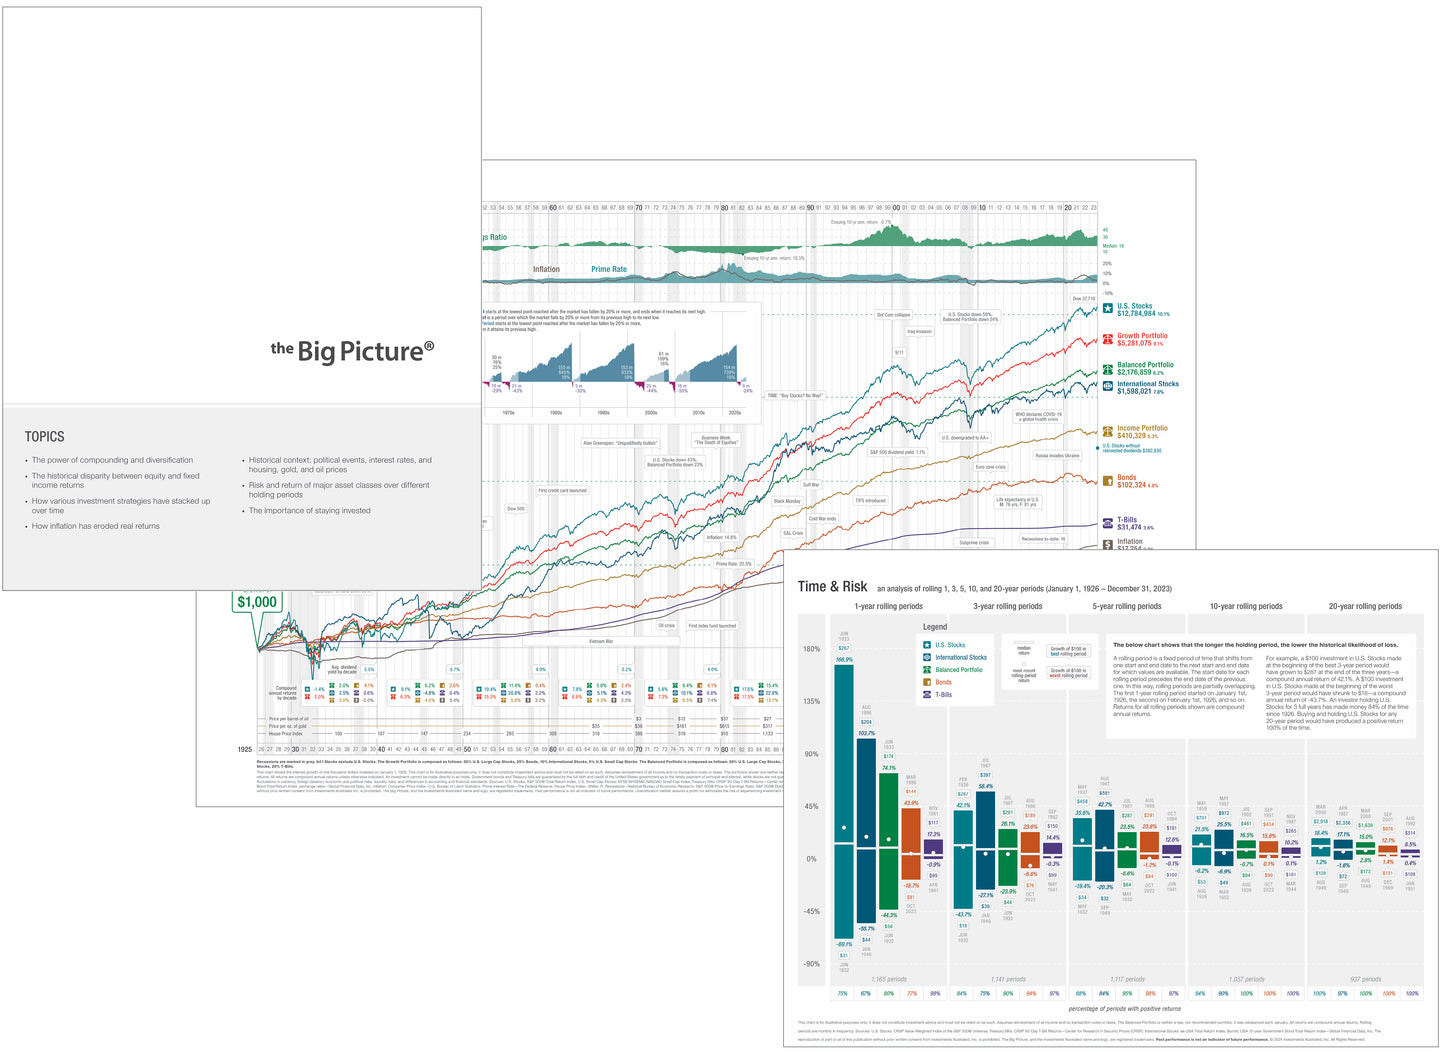
Product Details
Product Specifications
• Dimensions:
+ Wallchart - 37.75" × 25.25"
+ Handout - 8.5" × 11"
• Print Quality: Printed in ultra-fine resolution on premium-grade stock
• Coverage: Historical-return data from 1926 through the most-recent year end
• U.S. and Canadian versions available
• Updated annually: Annual revisions to include the most current data
Key Features
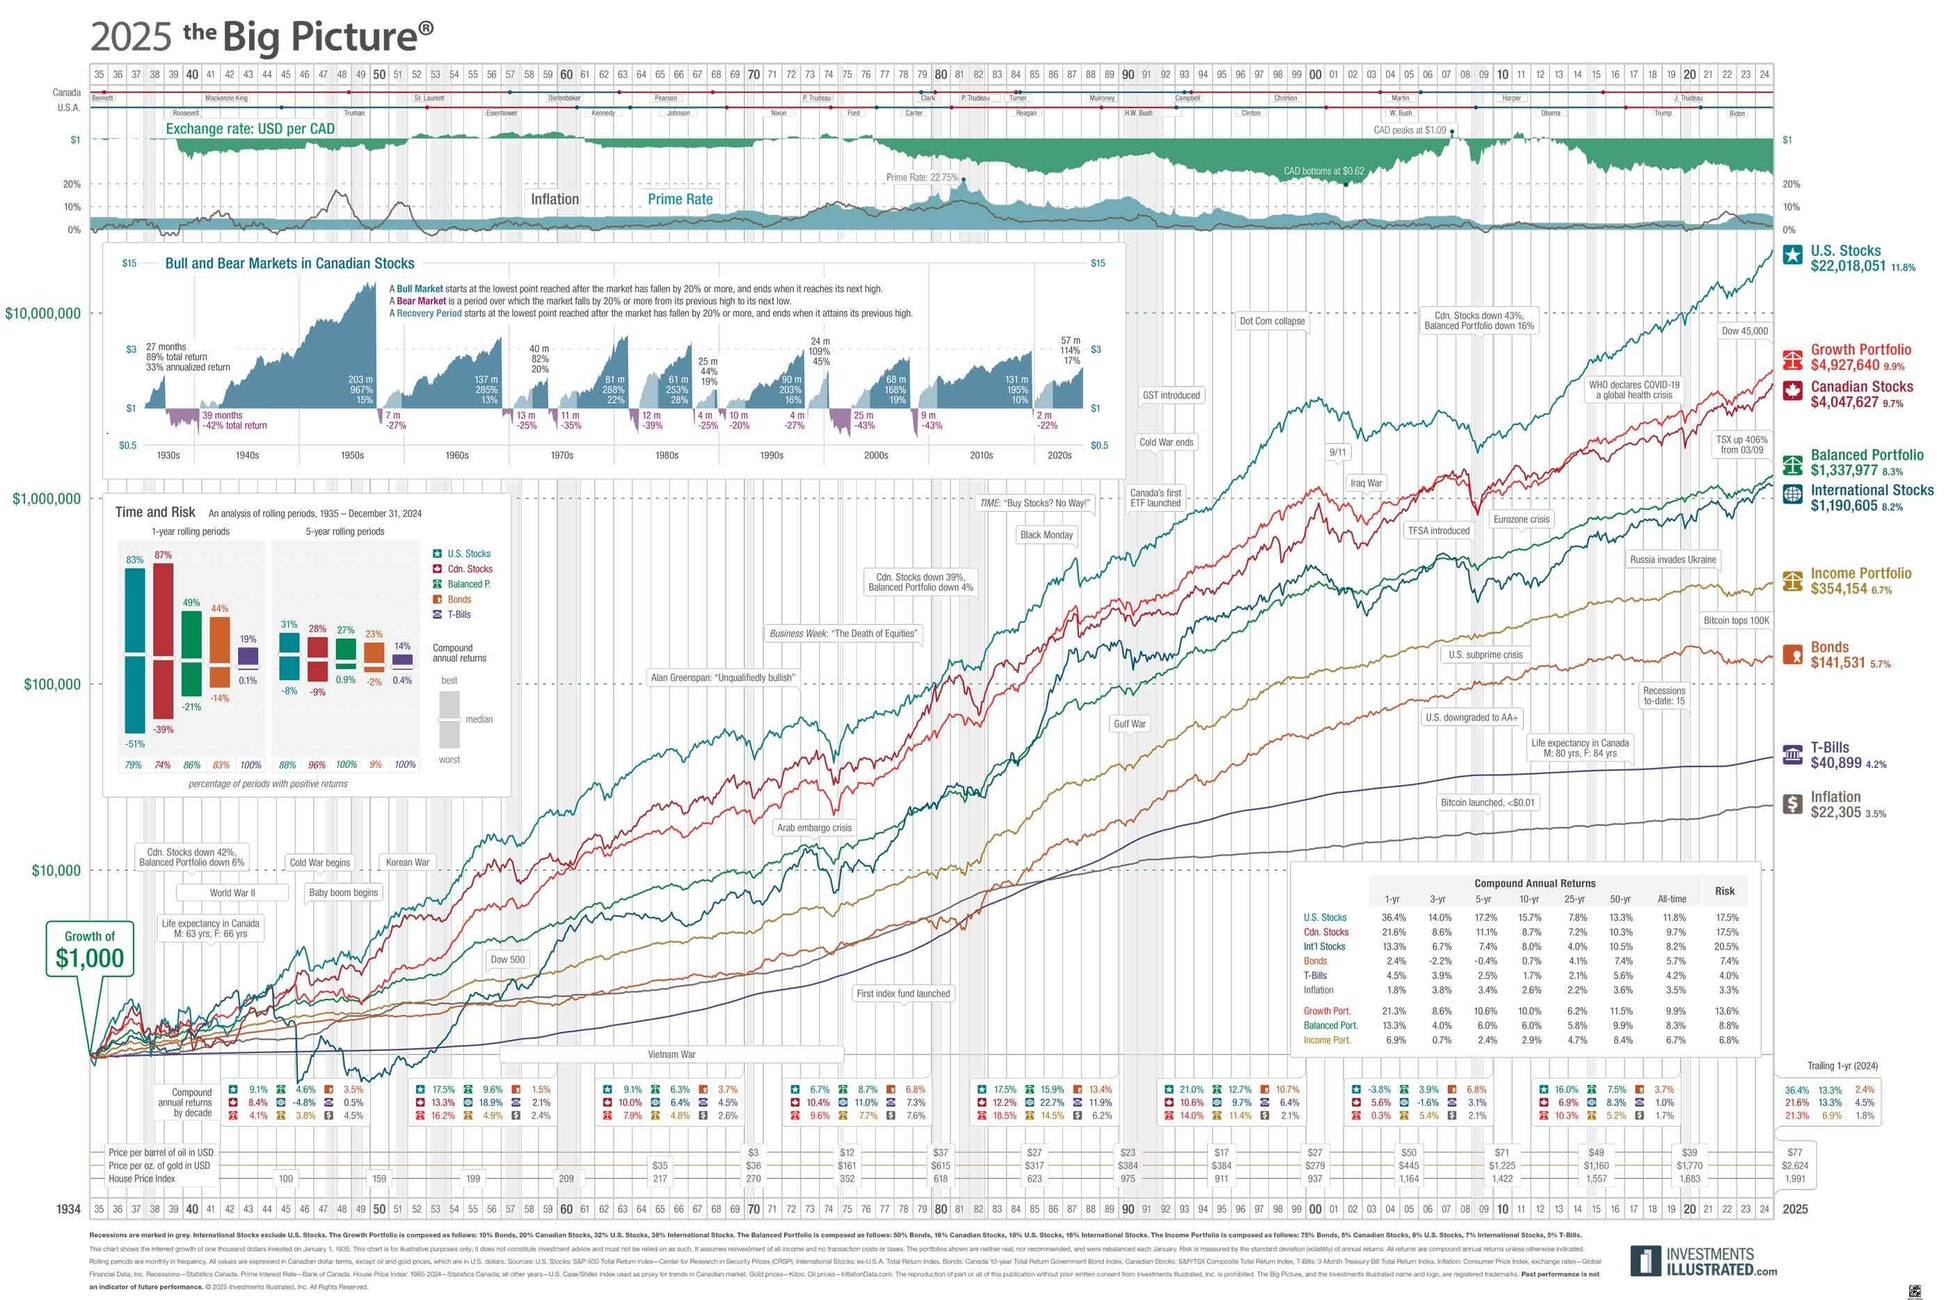
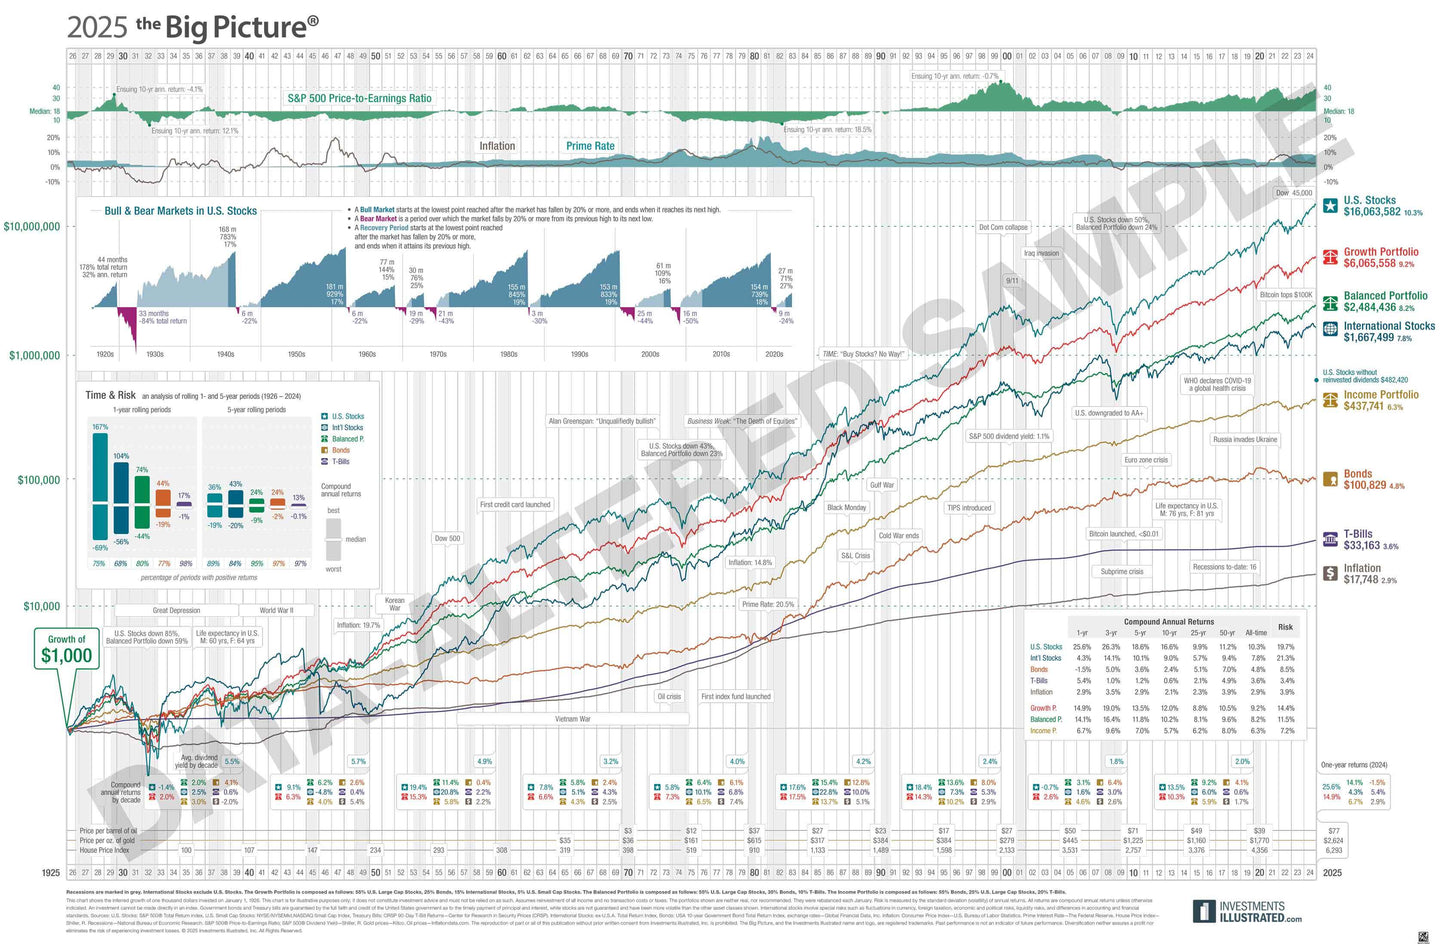
• Comprehensive Timeline: Visualize nearly 100 years of financial history at a glance
• Economic Events: Major milestones, crises, and their market impacts
• Market Cycles: Bull and bear markets with duration and percentage changes
• Asset Class Comparison: Performance of stocks, bonds, T-bills, and various portfolio types
• Economic Indicators: Trends in inflation, interest rates, GDP growth, and more
• Exchange Rates: (Canadian Edition) USD/CAD exchange rate history
Why Buy?
Our comprehensive chart serves as a powerful visual aid for client education, facilitating strategic discussions on diversification and long-term investing, while providing quick historical context for current market conditions, showcasing your commitment to data-driven analysis, and saving you time by offering a century of pre-compiled financial data at your fingertips.
Ideal Use Cases
Financial Advisors:
Display in your office to enhance client meetings and discussions
Asset Managers:
Co-brand the chart and empower your channel marketing.
Investment Firms:
Use in conference rooms for team strategy sessions and client presentations
Educational Institutions:
Incorporate into economics and finance classrooms for interactive learning
Personal Investors:
Gain a broader perspective on market history and trends for informed decision-making
Shipping & Returns
- Delivery: Shipped in a protective tube to prevent damage
- Timeframe: Standard shipping 5-7 business days, express options available
- International: We ship worldwide (additional fees may apply)
- Returns accepted only if damaged