
Big Picture Digital Version: Form
Use our charts and financial data for internal digital use and personalize with your logo and name.
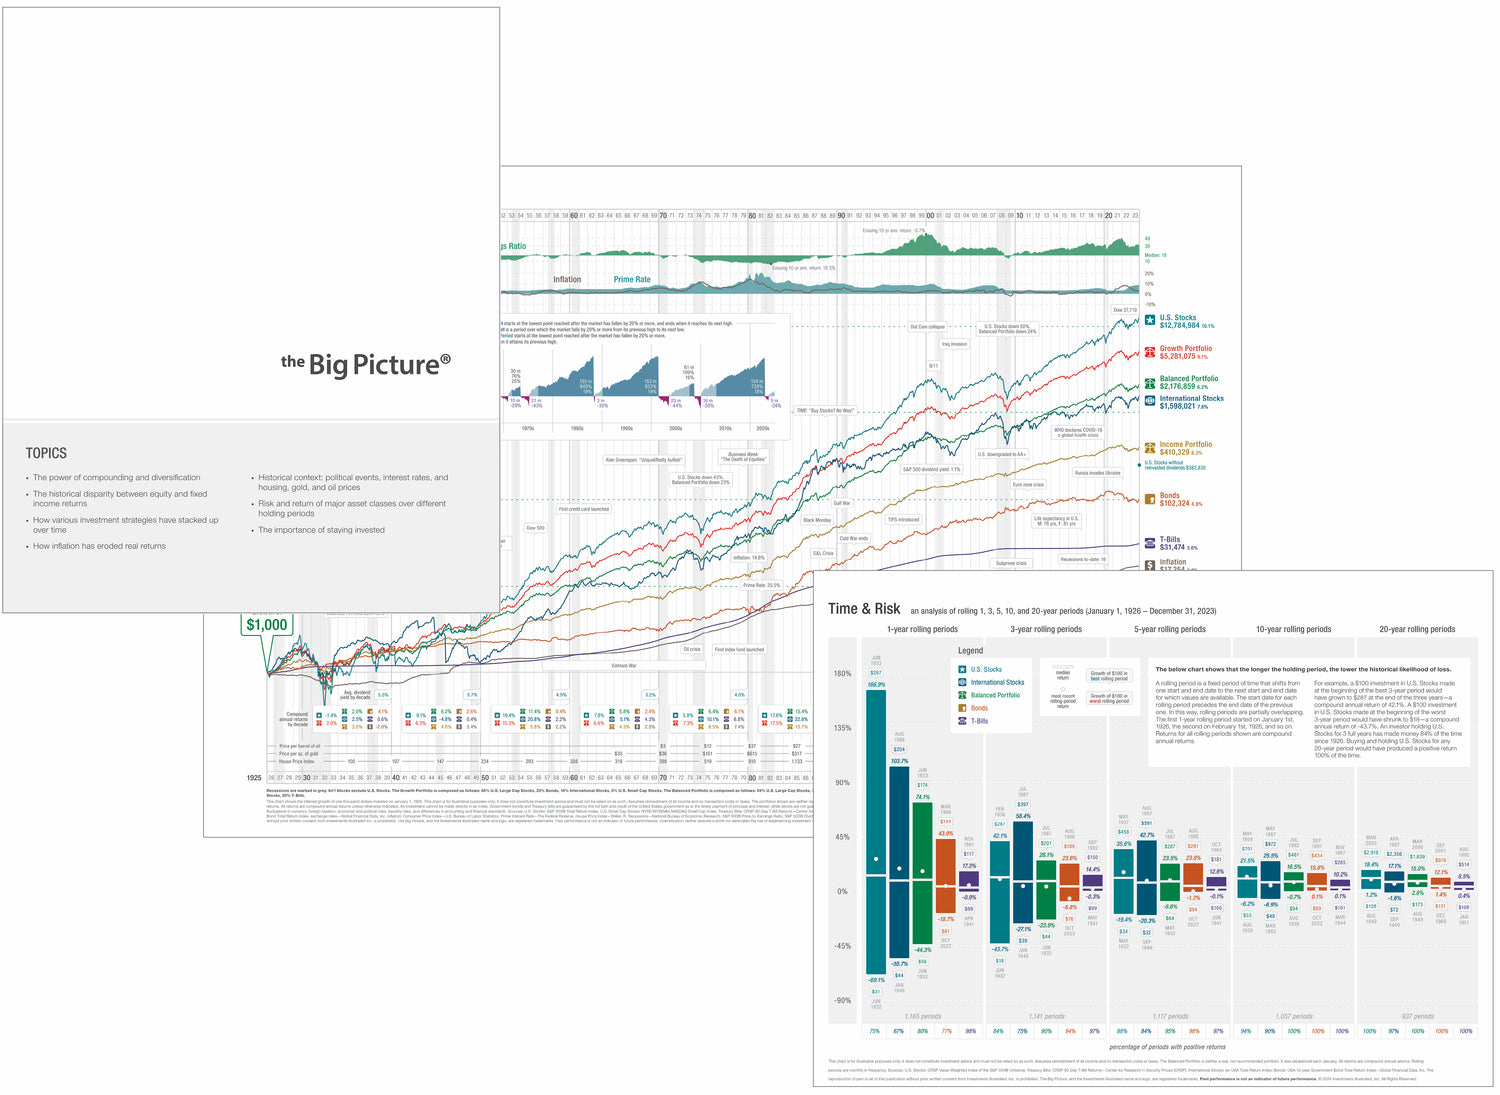
Bring Market History to Life
Visualize key investment principles with this all-in-one illustration of market history
-
Product Specifications
• Wallchart Dimensions:
+ 37.75” × 25.25”
+ 8.5” × 11”, Opens to 11” × 17”
• Premium-grade stock
• Print Quality: Ultra-fine resolution
• Financial data from 1926 - Present
• U.S. & Canadian Charts
• Annual updates released in Q1 -
Key Features
• Comprehensive Timeline: Visualize nearly 100 years of financial history at a glance
• Economic Events: Major milestones, crises, and their market impacts
• Market Cycles: Bull and bear markets with duration and percentage changes
• Asset Class Comparison: Performance of stocks, bonds, T-bills, and various model portfolios
• Economic Indicators: Trends in inflation, interest rates, and more
-
Who’s it For
• Personal Investors: Gain a broader perspective on market history and trends for informed decision-making
• Financial Advisors: Display in your office to enhance client meetings and discussions
• Educational Institutions: Incorporate into economics and finance classrooms for interactive learning
• For Volume Savings and customization options, please contact us at: info@investmentsillustrated.com