
Evidence-based safe withdrawal rate software
Will my money last?
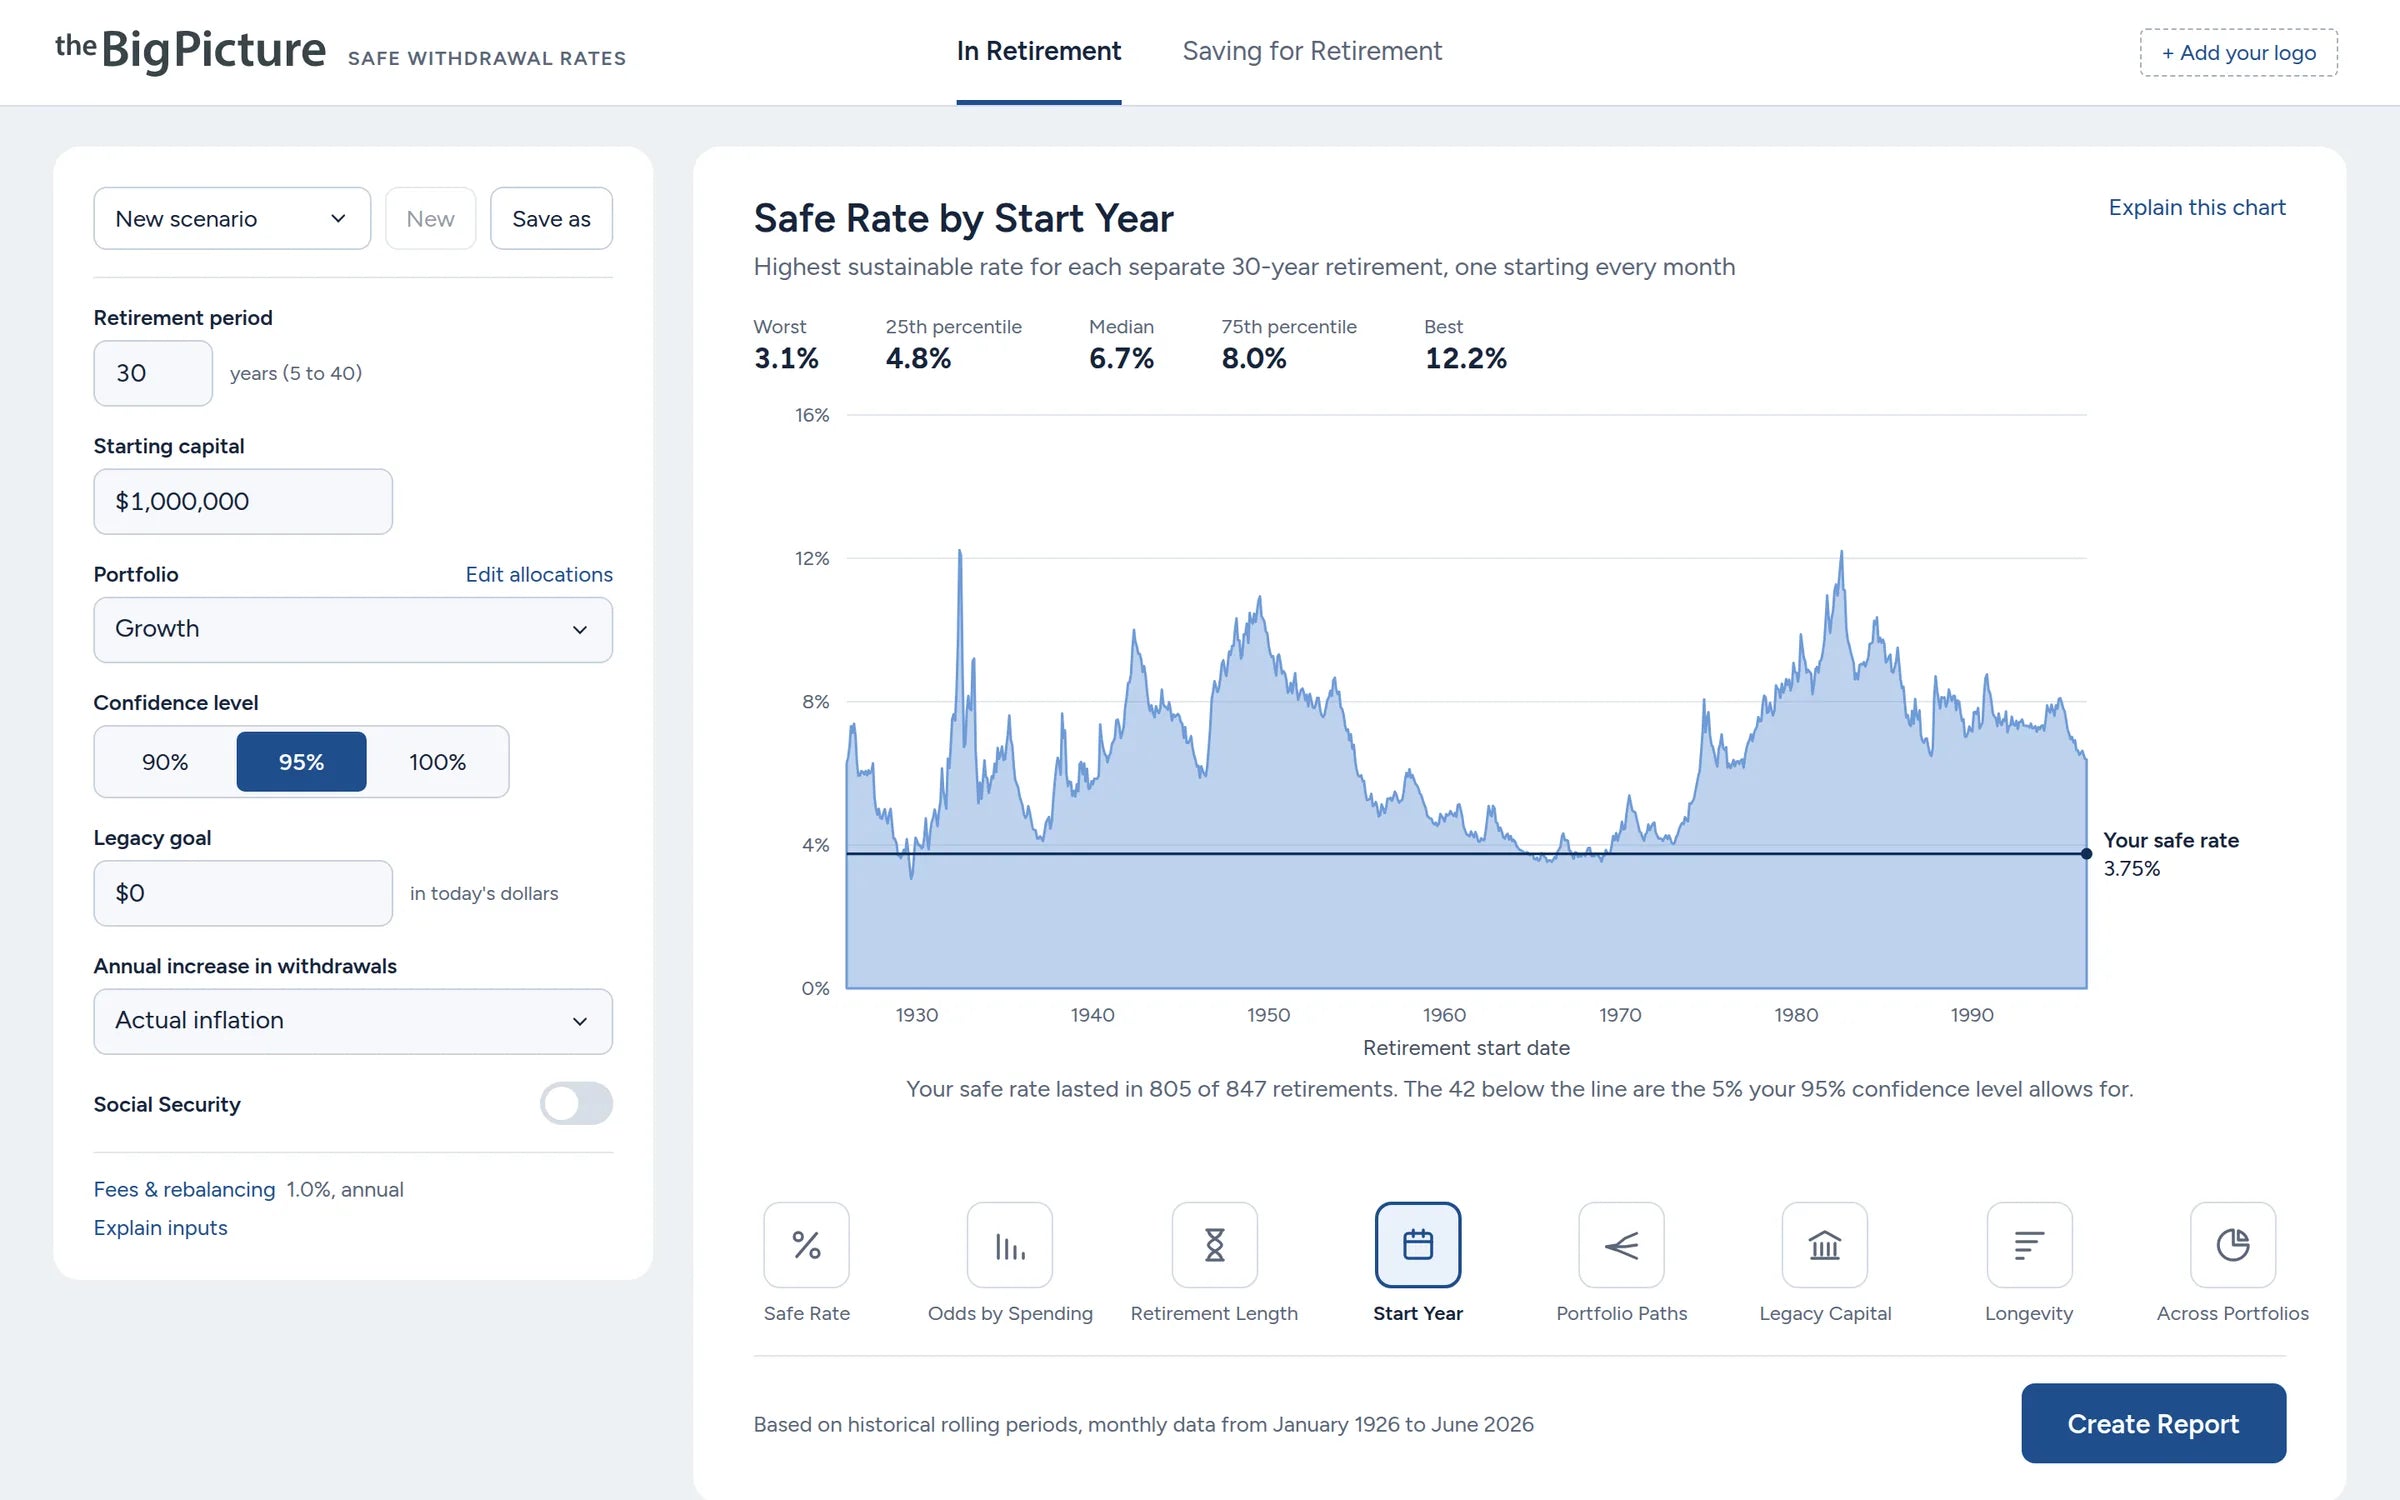
Enter your client's savings, portfolio, fees and retirement length. The program tests the plan against every retirement since 19261935, one starting each month, and shows the most they could have safely spent.
Runs in your browser. No card needed to start. Then $99 a month, or $1,070 a year.C$129 a month, or C$1,390 a year, plus tax.
Besides illustrating very quickly the effect of assumption changes on withdrawal rates, it's a lot of fun to use. I wish I'd had access to it in the early 1990's, when I began my research on the so-called ‘4% rule.’
 William P. BengenCreator of the 4% rule
Safe withdrawal rates, tailored to each client
Use it with prospects, new clients and longtime clients alike. Set up a plan in a minute: savings, portfolio, retirement length, fees and how much certainty they want. Then explore the trade-offs together: spend a little more or less, change the mix, add some flexibility, and see what history says about each.
What if they spend a little more?
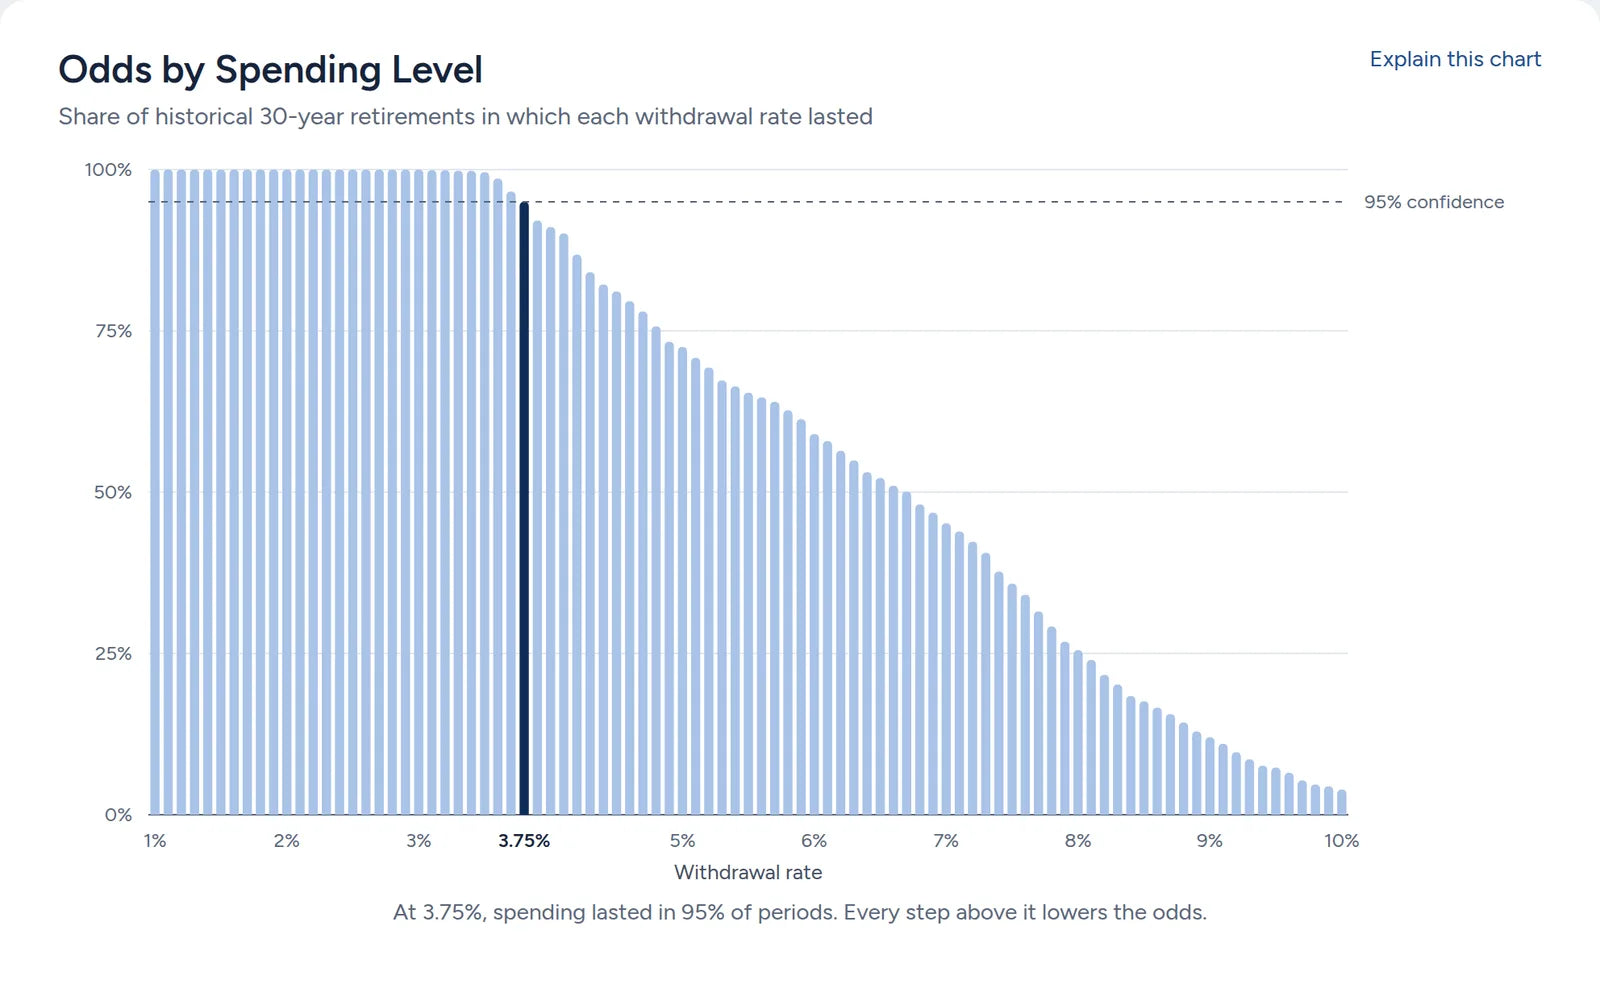
See how often each spending level would have lasted, from 1% to 10% of savings, with your client's safe rate marked. “Is 4% safe?” becomes a clear conversation about trade-offs.
Social Security, from the year it startsCPP and OAS, from the year each starts
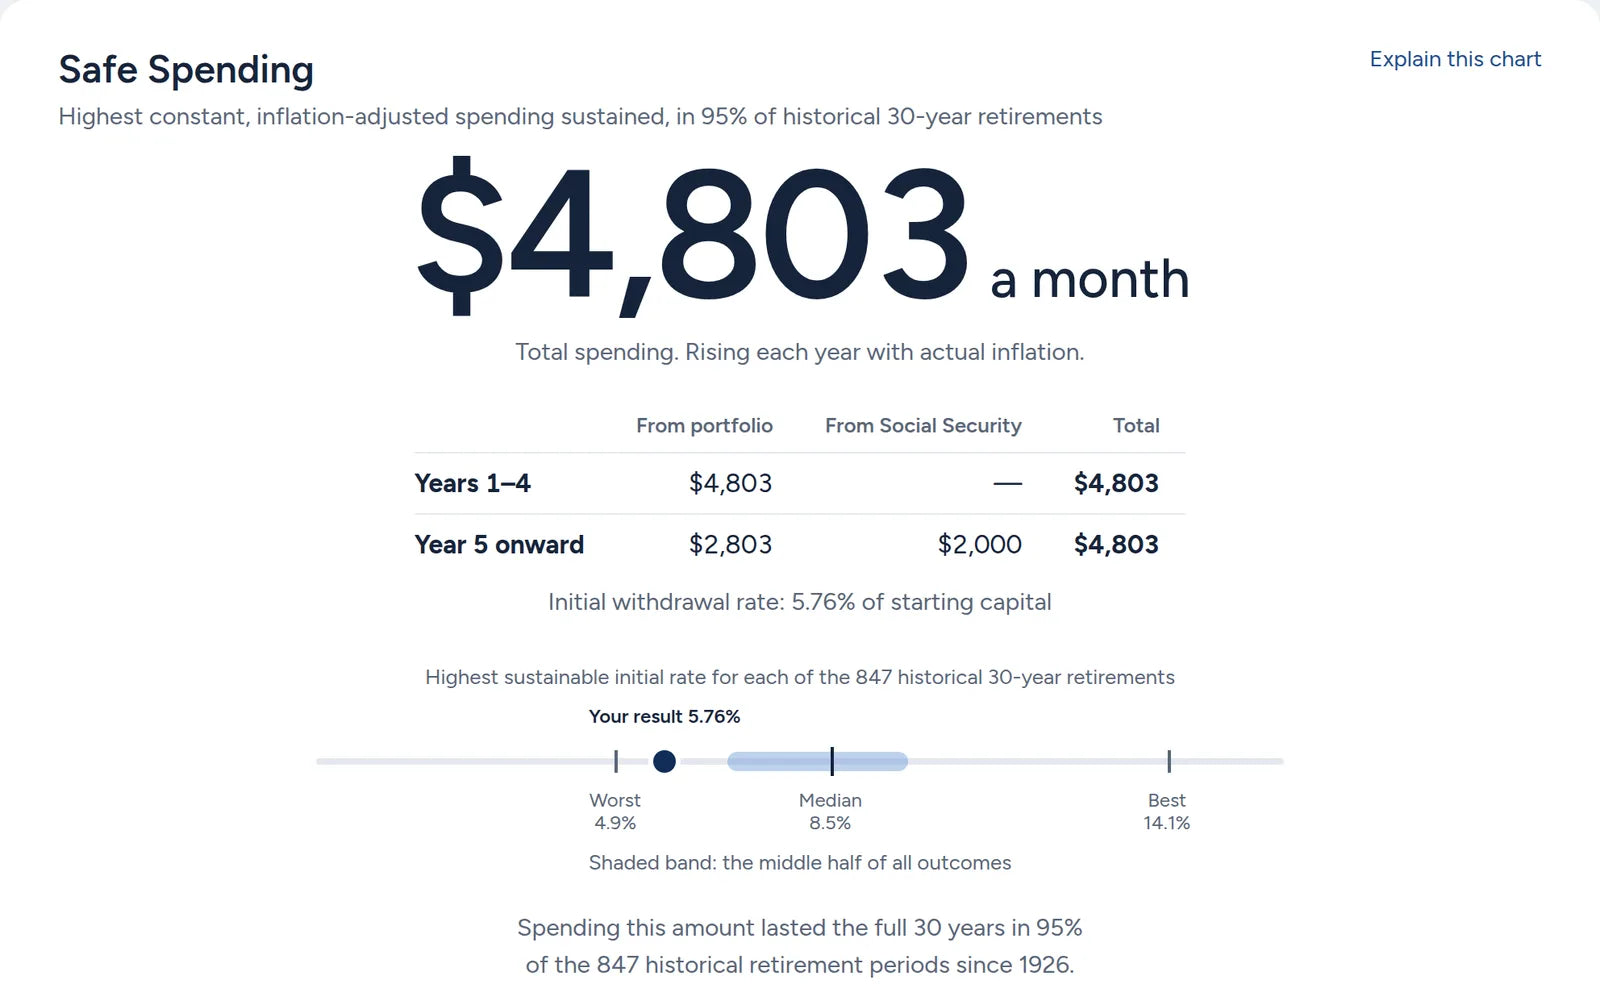
Add a benefit, or a pension, that begins partway through retirement. See total safe spending and how much comes from the portfolio before and after it starts.Add CPP and OAS, or a pension, each starting in its own year of retirement: OAS at 65 and CPP at 70, for example. See total safe spending and how much comes from the portfolio before and after they start.
How the money held up, year by year
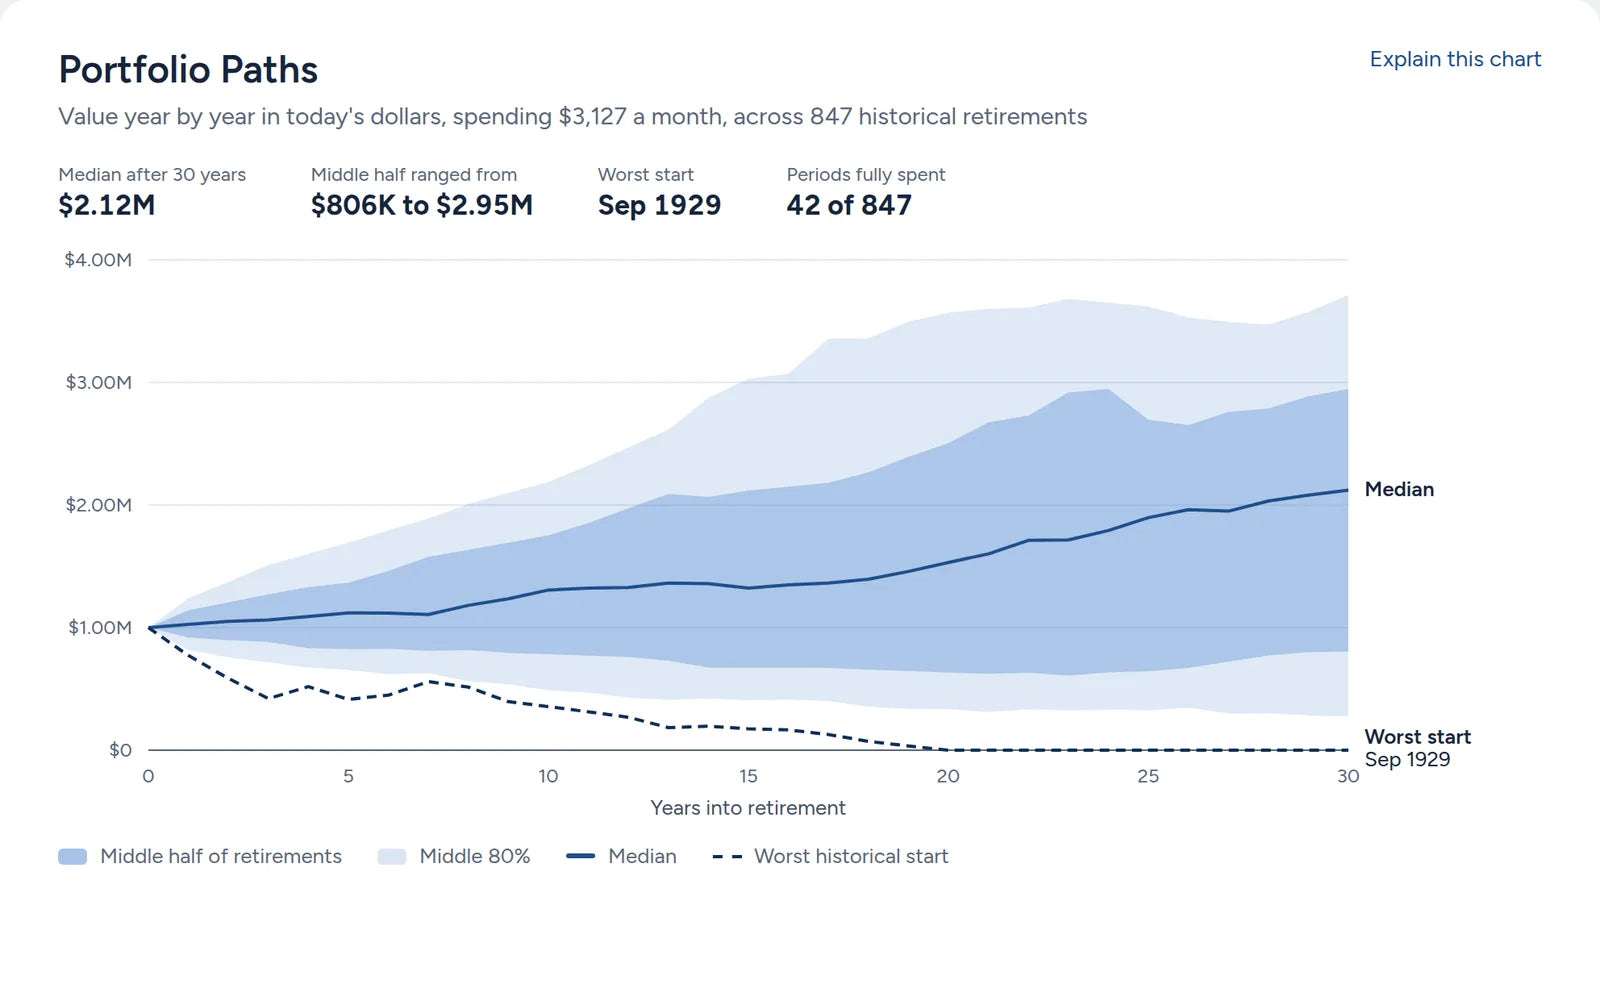
Follow the portfolio through every historical retirement in today's dollars, including the worst start on record. Most retirements ended with more than they began with.
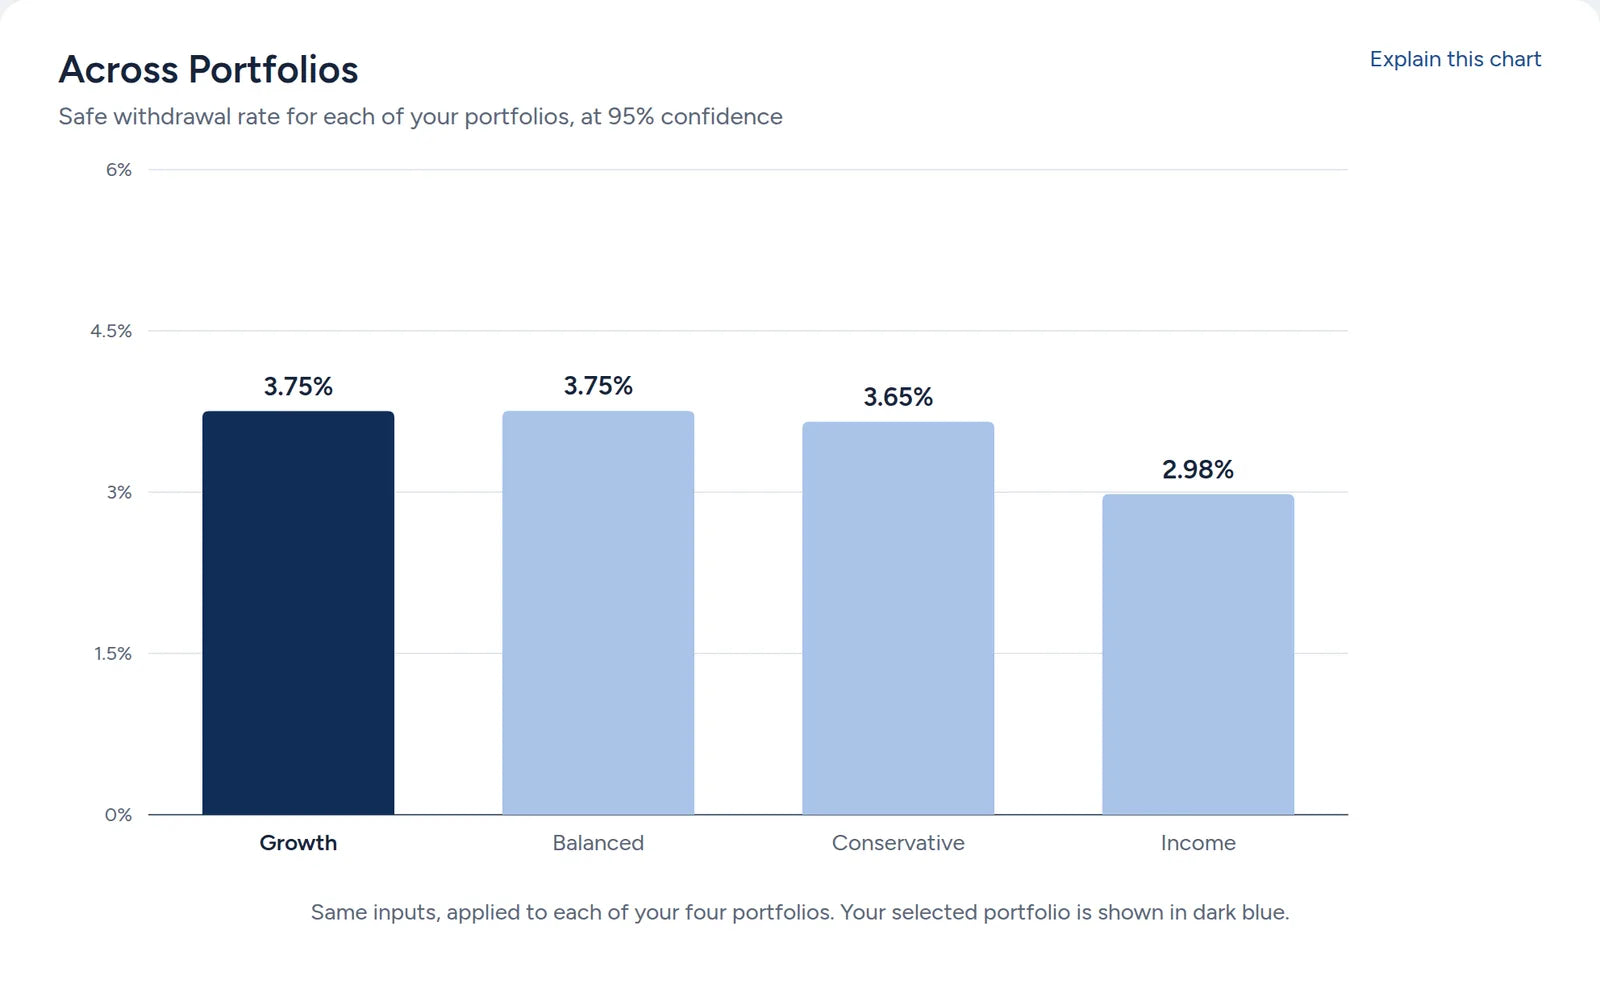
Four portfolios, side by side
Apply the same plan to four portfolios you build from twelve asset classes. The most aggressive mix isn't always the one that lets a client spend the most.
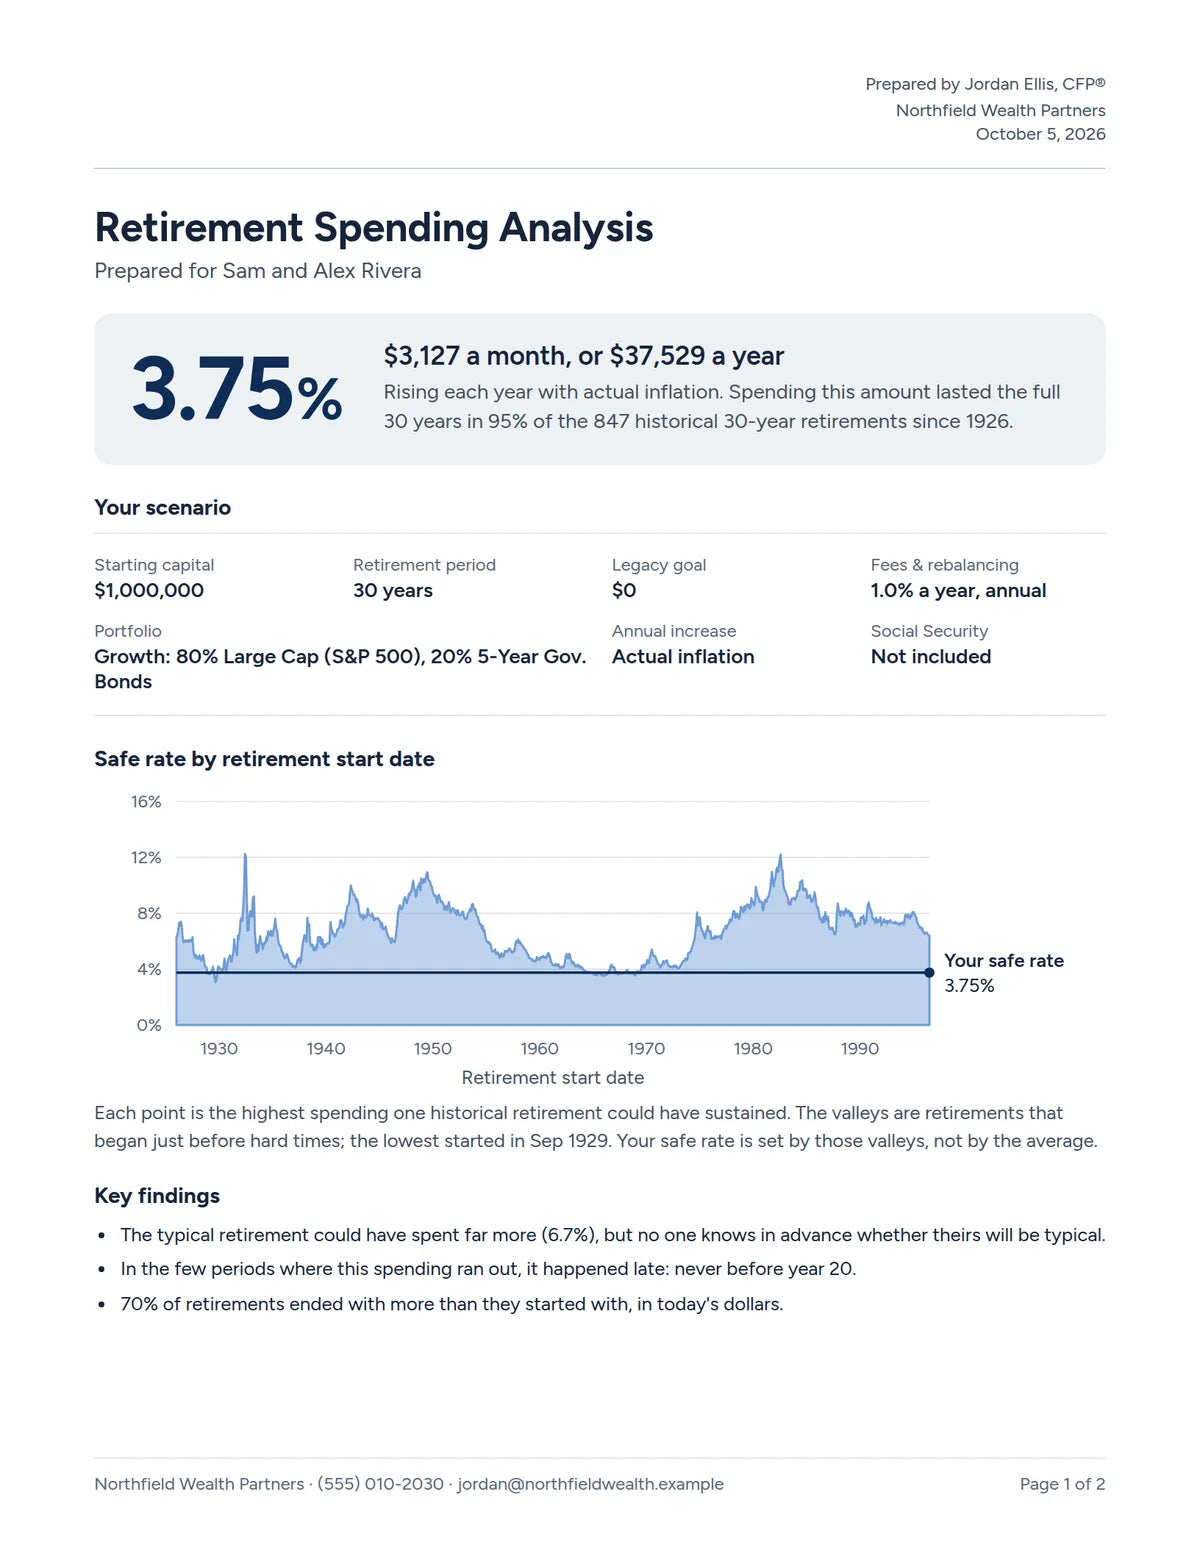
A report your client can keep
Turn any scenario into a two-page PDF with your name, firm and logo, written in plain language. Edit the wording before you download it.
You're a financial advisor, not a fortune teller
The future is unpredictable. Most planning tools rely on Monte Carlo simulations, built on guesses about future returns. The Big Picture grounds your advice in evidence: what actually happened, month by month, from the Great Depression through 1970s stagflation to today.from the 1930s through the Second World War and 1970s stagflation to today.
Twelve asset classes
U.S. large, mid, small, micro and total market stocks; international and emerging markets stocks; Treasury bills; 5- and 10-year government bonds; global bonds; and gold.Canadian stocks (S&P/TSX); U.S. large, mid, small and micro cap stocks; international and emerging markets stocks; Canadian Treasury bills and government bonds; U.S. 10-year government bonds; global bonds; and gold.
Monthly data since 19261935
From the Center for Research in Security Prices (CRSP) at the University of Chicago and Global Financial DataGlobal Financial Data and the Center for Research in Security Prices (CRSP) at the University of Chicago, in Canadian dollars, kept up to date.
Every rolling period
Each retirement starts one month after the last, so no market environment is skipped and no start date is cherry-picked.
-
If your retirement plan would have depleted your client’s funds using historical data, you should abandon it. The Big Picture does this test for you – quickly, intuitively and with an empirically sound framework.

Robert HuebscherFounder, Advisor Perspectives
-
I can picture a time when most financial planners routinely use the Big Picture to explore portfolio choices with their clients.

Bob VeresFinancial advisor and writer
-
Monte Carlo is a hypothetical projection based on assumed inputs. Clients relate more to the historical perspective that the Big Picture illustrates.

Steve ErbFinancial advisor, Chesme Capital
Try free for 14 days
No card needed to start. Choose a plan when you're ready; if you don't, your trial simply ends. Prices are in US dollars.Prices are in Canadian dollars, plus GST/HST.
Monthly
$99C$129 a month
Cancel anytime.
Yearly
$1,070C$1,390 a year
Works out to $89C$116 a month.
You save $118C$158 a year.
Nothing is charged during the trial. You choose monthly or yearly inside the program, whenever you're ready.
- Planning for retirement spending and for saving
- Eight retirement charts and four saving charts
- Social SecurityCPP, OAS, pensions and legacy goals
- Your own portfolios from twelve asset classes
- Unlimited client reports with your logo
- Saved scenarios and regular data updates
Questions advisors ask
How is this better than the 4% rule?
The 4% rule came from one landmark study: a 30-year retirement, one mix of stocks and bonds, and no fees. Your clients' plans differ on every count. The Big Picture finds the safe rate for their own portfolio, fees, retirement length and comfort with risk, and shows the history behind the number.
How is this different from a Monte Carlo simulation?
Monte Carlo tools rely on assumptions about future returns, volatility and correlations, and use them to generate hypothetical paths. They're useful, but theoretical. The Big Picture uses what actually happened, including the real sequences of good and bad years that random models can smooth away. Neither approach predicts the future; both are guides to sensible decisions.
Is history a prudent guide? What if future returns are lower?
No one knows what future returns will be. Nearly a century of data includes a depression, a world war,More than 90 years of data include a world war, 1970s stagflation, double-digit interest rates and several crashes. A plan that held up through all of that is prepared for a wide range of futures. Forecasts are a weak foundation: in 1979, Business Week declared “The Death of Equities” on the eve of one of history's great bull markets. To simulate lower returns, simply raise the annual fee, which effectively lowers returns in every period.
Does it replace my planning software?
No, and it isn't meant to. The Big Picture is built for the conversation: showing a prospect what's realistic, setting expectations with a new client, or revisiting the plan with a longtime one. Use it alongside your planning software to make the trade-offs clear and the numbers believable.
Can it reflect my client's real situation?
Yes. Build up to four portfolios from twelve asset classes and set the fees and rebalancing. Add Social Security or a pension from the year it startsCPP, OAS or a pension, each from the year it starts, a legacy to leave behind, and how spending should grow: with actual inflation, at a fixed rate, or not at all.
Does it help clients who are still saving?
Yes. Saving for Retirement works the same way for savers: it shows the historical odds of reaching a savings target, and the trade-offs among portfolio, saving, fees and time.
What is a little spending flexibility worth?
Often more than clients expect. One option holds spending flat for a year after the portfolio has a down year, then resumes inflation increases. That modest belt-tightening has historically raised safe rates by about half a percentage point, and the program shows the effect for any plan.
We deliberately stop there. Research on how retirees' spending changes over time is mixed (some studies find it falls, others that it rises with medical costs), and the early years of retirement largely decide the outcome anyway.
What happens in the bad scenarios?
Failure is rarely sudden. At the safe rate, the historical retirements that did run out of money did so late in the period, which leaves time to notice and adjust. That's why we suggest revisiting the plan every year or two: after good markets, clients can often give themselves a raise.
Will my clients understand it?
That's the point. Every result is tied to real events, from 1929 to the 1970sfrom the Second World War to the 1970s, rather than abstract probabilities. Each chart comes with a plain-language explanation, and the client report is written for clients, not analysts.
Are taxes included?
Results are before tax, because taxes depend on the account type, jurisdiction and cost basis of each client. To approximate their drag on returns, simply raise the annual fee.
Where does the data come from?
U.S. stocks, Treasury bills and 5-year government bonds come from the Center for Research in Security Prices (CRSP) at the University of Chicago. International and emerging markets stocks, 10-year government bonds, global bonds and gold come from Global Financial Data, and inflation from the U.S. Bureau of Labor Statistics and Global Financial Data. All are monthly total returns from January 1926.Canadian stocks, bonds and Treasury bills, international and emerging markets stocks, U.S. 10-year government bonds, global bonds, gold and Canadian inflation come from Global Financial Data. U.S. stocks come from the Center for Research in Security Prices (CRSP) at the University of Chicago. All are monthly total returns in Canadian dollars from January 1935, with U.S. and international returns converted at historical exchange rates.
What happens when the trial ends?
Choose monthly or yearly billing at any point during your trial; nothing is charged until the trial is over. If you don't choose a plan, access simply ends, and your saved work is kept in case you come back. For two or more advisors, contact us about a team plan.
See what history says about your client's plan
No card needed to start.